

Spotlight Trade - Gold Index ETF
In todays issue:
- Step-by-Step overview of Spotlight Trade - Gold Index ETF
- Update on active trades
Trading Rule #1 -Market Portfolio
The Gold Miners ETF is one of the over fifty markets that we follow and review daily. Over the past weeks we have noticed strength in a number of basic materials markets with the commodity sector.
This ETF includes some of the biggest gold mining companies include Newmont, Barrick and Franco-Nevada.
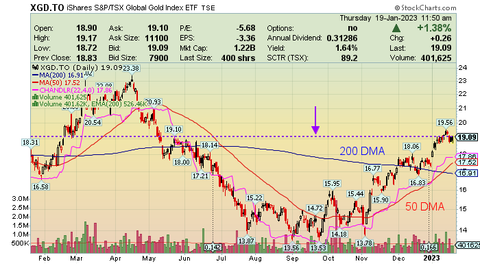
You can see on the above chart that XGD has developed a nice round bottom and has start to trend up. It is quickly approaching a 6 month high of $19.10 shown by the purple line on the chart.
You will also notice that the price has broken out above the 200 DMA which is the blue line on the chart. You can also see from the chart that the 50 DMA, which is shown by the red line, has just crossed the 200 DMA to form a bullish golden cross.
The fact that the Gold Miners ETF has closed above the 200 DMA, has formed a bullish golden cross and is quickly approach a six month high confirms that this market is definitely showing strength and one that we should be paying attention to.

On the above chart we have now zoomed into to the XGD to see the current price action
Our Trading Rule #2 identifies potential trade setups for securities on our watchlist.
The Gold ETF became a potential trade set-up when it broke out and closed above the 6 month high of $19.10. The breakout level is illustrated by the dashed purple line on the chart.
Some traders may have identified this as a potential trade set-up when it broke out above the 200 DMA which is shown by the blue arrow or when the faster 50 DMA average cross above the slower 200 DMA which is shown by the red arrow. Its interesting to note the this golden cross and the breakout above the 6 month high happen almost simultaneously. Hopefully that bodes well for this trade.
Trading Rule #3 - Entering the Trade

Our trading rule number 3 states that we will enter the trade if there is a follow through on the breakout .
The orange line on the above chart is the high price of the ETF once it broke out and closed above the 6 month high. We placed a buy on stop order to enter the trade at $19.27 if the price continued to trade higher. You can see by the purple box that the next day the price continued higher and our buy on stop order was filled and we were in the trade.

Our Trading rule #4 states that we must know where we will get out if we are wrong and the upward trend does not continue. And as with most successful traders we are wrong more that we are right.
We placed our stop loss at $17.98 which is shown by the brown line on the chart.
We calculate our stop loss using Average True Range which measures the average volatility of this XGD ETF over the past 20 days.
You can see from the graph in the bottom of the stock chart that the ATR was $0.43 when we initiated the trade.
In order to give the trade some breathing room we use a 3 x ATR which in this case is $1.29.
We calculate our $17.98 stop loss price by subtracting the 3 x ATR from our $19.27 purchase price. As soon as our entry order is filled we place our stop loss order with our broker so that the trade will automatically be closed if the stop loss price is hit.
Trading Rule #5 -How much to Buy
Once we know our entry price and stop loss price we can calculate how many shares of the ETF we should purchase.
In this case we are willing to risk 0.50% or $500 of our theoretically $100,000 portfolio if we are wrong.
By dividing our bet amount of $500 by the difference between the purchase price and stop loss price we determined that we can buy 387 shares of the security. Defining the bet size of ever trade is the key to long term trading success.
Active Trades

The above table shows our active trades.
We currently have 8 active trades. Over the past week we entered into 3 new trades which are shown in orange in the table. Along with the Gold Miners trade we just reviewed, our trading strategy also got us into positions in the a small cap equity ETF and a Copper related equity trade.
We are currently about 65% invested.
Please let us know if you have any questions or comments.
Good luck and good trading!
We are not suggesting that you should purchase the securities that we highlight in this blog but rather see the steps, and the thought process, we go through to remove emotions from the trading process and systematically implement our trading rules.
It is our belief that each trader should develop their own trading strategy that fits their personality and with rules they understand and can systematically execute. If you are interested in building a personalized Trading Strategy please check out the FREE Preview of our Trading Course "How to Build a Systematic, Rules-Based, Trading Strategy" and get started trading your way to financial freedom!